Scherlok MCP Server
io.github.rbmuller/scherlok
Zero-config anomaly detection for data warehouses—learn patterns, catch problems automatically.
What is the Scherlok MCP server?
Scherlok is a zero-config data-quality monitoring tool that automatically profiles database tables and detects anomalies without requiring predefined rules or thresholds. It learns what "normal" looks like from your data, then alerts you to volume drops, NULL surges, schema drift, freshness issues, and distribution shifts via Slack, Discord, Teams, email, or CI exit codes.
Scherlok eliminates the need for hundreds of data-quality rules by learning baseline patterns from your warehouse automatically. After an initial profile, it detects anomalies like row-count drops, NULL rate spikes, cardinality explosions, and distribution shifts using statistical control limits. It integrates with PostgreSQL, BigQuery, Snowflake, MySQL, DuckDB, and dbt projects, and can gate CI/CD pipelines or send alerts to Slack, Discord, Teams, or email.
How to install Scherlok
Copy-paste configuration for popular MCP clients.
SCHERLOK_CONNECTIONrequiredsecretWarehouse connection string (postgresql://, bigquery://, snowflake://, mysql://, duckdb:///path). Resolved server-side; never passed by the model.
Tools & capabilities
Tools this server exposes to the agent.
investigate— Profile all tables in a database to learn baseline patterns, row counts, column types, NULL rates, value distributions, freshness cadence, and cardinality.watch— Detect anomalies in profiled tables and alert via Slack, Discord, Teams, email, or CI exit code with severity levels (INFO, WARNING, CRITICAL).ci— All-in-one command for CI/CD pipelines: connect, profile, detect anomalies, and optionally fail the pipeline on critical issues.dbt— Profile dbt models directly from a dbt project, auto-discovering materialized models and resolving database connections from profiles.yml.dbt-run-and-watch— Run dbt and profile successful models in one step, with optional failure gating on anomalies.dashboard— Generate a self-contained HTML report with KPIs, per-table incidents, schema-drift diffs, sparklines, and anomaly history.status— Quick health dashboard showing current state of monitored tables.history— Timeline view of past anomalies with filtering by time range.explain— AI-powered root-cause hypothesis for anomalies using Claude, injected into alerts (opt-in, costs ~$0.003 per run).list_tables— MCP tool to list all tables in the connected database.check— Run a single data-quality check and return results.
Use cases
- Detect silent data pipeline failures (e.g., API returning cents instead of dollars) before they impact dashboards or reports.
- Gate CI/CD pipelines to prevent bad data from reaching production by failing on critical anomalies.
- Monitor dbt model outputs automatically without writing custom tests, complementing dbt test with statistical anomaly detection.
- Alert data teams to freshness issues, NULL surges, or row-count drops via Slack or email in real time.
- Generate HTML reports and dashboards for stakeholders showing data-quality incidents and trends over time.
Scherlok MCP server FAQ
Scherlok is a zero-config anomaly-detection tool for data warehouses. It automatically profiles your tables, learns what "normal" looks like, and detects anomalies like volume drops, NULL surges, schema drift, and distribution shifts—no rules or thresholds to configure.
Yes. Scherlok is open-source under the MIT license. The core tool is free. Optional AI-powered explanations (--explain) use Claude Haiku and cost ~$0.003 per run.
For Claude Desktop, download the .mcpb file from the latest release and open it. For other clients, install via pip (pip install scherlok) and configure the MCP server in your client's settings with your database connection string as an environment variable.
PostgreSQL, BigQuery, Snowflake, MySQL, and DuckDB. It also integrates with dbt projects to profile models directly.
Database credentials are required to connect to your warehouse. Optional: Slack/Discord/Teams webhooks for alerts, SMTP credentials for email, and Anthropic API key for AI explanations (--explain flag).
Yes. Use scherlok ci <url> --fail-on critical to fail your pipeline if critical anomalies are detected, preventing bad data from reaching production.
README (reference)
Source of truth, from the repository.
<br><br>
<img src="assets/scherlok-logo.png" alt="Scherlok" width="120"> <h1>Scherlok</h1> <p><strong>Zero-config anomaly detection for your database tables.</strong><br> No YAML, no rules, no thresholds. Scherlok learns what "normal" looks like, then tells you when something changes.</p> </div>pip install scherlok
scherlok ci postgres://user:pass@host/db # profiles on the first run, detects anomalies on every run after
No database handy? The demo seeds one, learns it, breaks it, and catches it, in about a second:
uvx --from "scherlok[duckdb]" scherlok demo
Works with PostgreSQL, BigQuery, Snowflake, MySQL, DuckDB and dbt. Alerts go to Slack, Discord, Teams, email, or your CI exit code.
The Problem
Every data team has the same nightmare:
A source API silently changes from dollars to cents. Revenue dashboards show wrong numbers for 3 weeks before anyone notices.
A column starts returning NULLs. A table stops updating. Row counts drop 40% on a Tuesday. Nobody knows until the CEO asks why the report looks weird.
Current tools (Great Expectations, Soda, dbt tests) require you to define what "correct" looks like before you can detect what's wrong. Hundreds of rules. Dozens of YAML files. And you still miss things — because you can't write rules for problems you haven't imagined yet.
What It Catches
| Anomaly | What Happened | Severity |
|---|---|---|
| Volume drop | Row count dropped 40% overnight | CRITICAL |
| Volume spike | 3x more rows than normal | WARNING |
| Freshness alert | Table hasn't updated in 12h (normally every 2h) | CRITICAL |
| Schema drift | Column removed or type changed | CRITICAL |
| NULL surge | NULL rate jumped from 2% to 45% | WARNING |
| Distribution shift | Column mean shifted 3+ standard deviations (Shewhart-style control limit) | INFO, WARNING above 5σ |
| Cardinality explosion | Status column went from 5 values to 500 | CRITICAL |
Every anomaly is auto-scored: INFO, WARNING, or CRITICAL. No thresholds to configure.
How It Works
Scherlok takes the opposite approach of rule-based tools: learn first, then detect.
scherlok connect postgres://user:pass@host/db   # connect once
scherlok investigate                              # learn your data
scherlok watch                                    # detect anomalies
Three commands. Five minutes. Done. (scherlok ci <url> runs all three in one step for pipelines.)
After five valid profiles, Scherlok learns per-metric variability from the latest 30 profiles using robust historical baselines for volume, numeric mean shifts, NULL rates, and distinct counts. During cold start or when history is not usable, it keeps the conservative fixed defaults.
1. investigate — Learn the patterns
$ scherlok investigate

  Profiling 12 tables...
  ✓ users         — 45,231 rows, 8 columns
  ✓ orders        — 1,203,847 rows, 15 columns
  ✓ products      — 892 rows, 12 columns
  ...
  Done. Profiles saved.
Scherlok profiles every table: row counts, column types, NULL rates, value distributions, freshness cadence, cardinality. Stores everything locally in SQLite.
2. watch — Detect anomalies
$ scherlok watch

  Checking 12 tables against learned profiles...

  🔴 CRITICAL  orders    volume_drop     Row count dropped 52% (1,203,847 → 578,412)
  🟡 WARNING   users     null_increase   Column "email": NULL rate 2.1% → 18.7%
  🔵 INFO      products  distribution    Column "price": mean shifted 3.2σ

  3 anomalies detected. Exit code: 1
3. Alert — Slack, CI/CD, or both
# Slack
scherlok watch --webhook https://hooks.slack.com/services/...

# Discord
scherlok watch --webhook https://discord.com/api/webhooks/...

# Microsoft Teams
scherlok watch --webhook https://outlook.office.com/webhook/...

# Any endpoint (generic JSON payload)
scherlok watch --webhook https://my-api.com/alerts

# CI/CD gate (fails pipeline on CRITICAL)
scherlok watch --exit-code --fail-on critical
Auto-detects Slack, Discord, and Teams from the URL and formats the payload accordingly. Any other URL receives a generic JSON payload.
CI/CD Integration
Use Scherlok as a data quality gate. The ci command does it in one line:
# GitHub Actions
- name: Data quality check
  run: |
    pip install scherlok
    scherlok config --store s3://my-bucket/scherlok/profiles.db
    scherlok ci ${{ secrets.DATABASE_URL }} \
      --webhook ${{ secrets.SLACK_WEBHOOK }} \
      --fail-on critical
If Scherlok detects a critical anomaly, the pipeline fails. Bad data never reaches production.
Works with dbt
Already running dbt? Scherlok complements dbt test with automatic anomaly detection — no rules to write.
pip install scherlok[dbt]

# After `dbt run`, point Scherlok at your project
scherlok dbt --project-dir ./my_dbt_project
Scherlok reads target/manifest.json, discovers every materialized model (table, incremental, view), auto-resolves the connection from your profiles.yml, and profiles each model:
Investigating 4 dbt models in ./my_dbt_project (postgres)
  ✓ stg_customers                  (12,345 rows)
  ✓ stg_orders                     (98,765 rows)
  ✗ fct_orders                     CRITICAL: Row count dropped 42% (98,765 → 57,283)
  ✓ dim_customers_inc              (12,300 rows)

Summary: 4 profiled, 1 anomalies (1 critical, 0 warning)
Use it as a CI gate after dbt run:
- run: dbt run --target prod
- run: scherlok dbt --project-dir . --target prod --fail-on critical
Or collapse both steps into one with the wrapper:
- run: scherlok dbt-run-and-watch --project-dir . --target prod --fail-on critical
The wrapper runs dbt run by default and uses the successful model nodes recorded in
target/run_results.json, so partial runs profile only what dbt actually built. Use
--build to run dbt build; successful models are still profiled when a test failure
causes downstream models to be skipped on dbt's handled failure path (exit 1), while
the wrapper preserves dbt build's exit code. Unhandled failures fail fast without
reading the artifact.
Both dbt and dbt-run-and-watch accept --output json for CI parsers — a single JSON document on stdout, nothing else.
Supported adapters: postgres, bigquery, snowflake, mysql, duckdb. For others, pass --connection-string explicitly.
📖 Full docs: dbt integration guide →
dbt Package — native tests
Prefer staying inside dbt? Install Scherlok as a dbt package for native data quality tests — no Python CLI needed.
# packages.yml
packages:
  - git: https://github.com/rbmuller/scherlok.git
    revision: v1.0.4
Once the dbt Package Hub listing lands (dbt-labs/hubcap#456), this becomes package: rbmuller/scherlok with version: [">=1.0.0", "<2.0.0"].
# schema.yml
models:
  - name: fct_orders
    tests:
      - scherlok.volume_anomaly:
          sensitivity: 3.0
      - scherlok.row_count_between:
          min_value: 100
    columns:
      - name: email
        tests:
          - scherlok.not_null_proportion:
              max_rate: 0.01
      - name: updated_at
        tests:
          - scherlok.recency:
              days: 2
Tier 1 — Instant (no setup): not_null_proportion, row_count_between, recency, unique_proportion
Tier 2 — Auto-learning (Shewhart control limits): volume_anomaly, null_anomaly — require the scherlok_metrics model to build baseline history.
📖 Full docs: dbt package README →
HTML dashboard
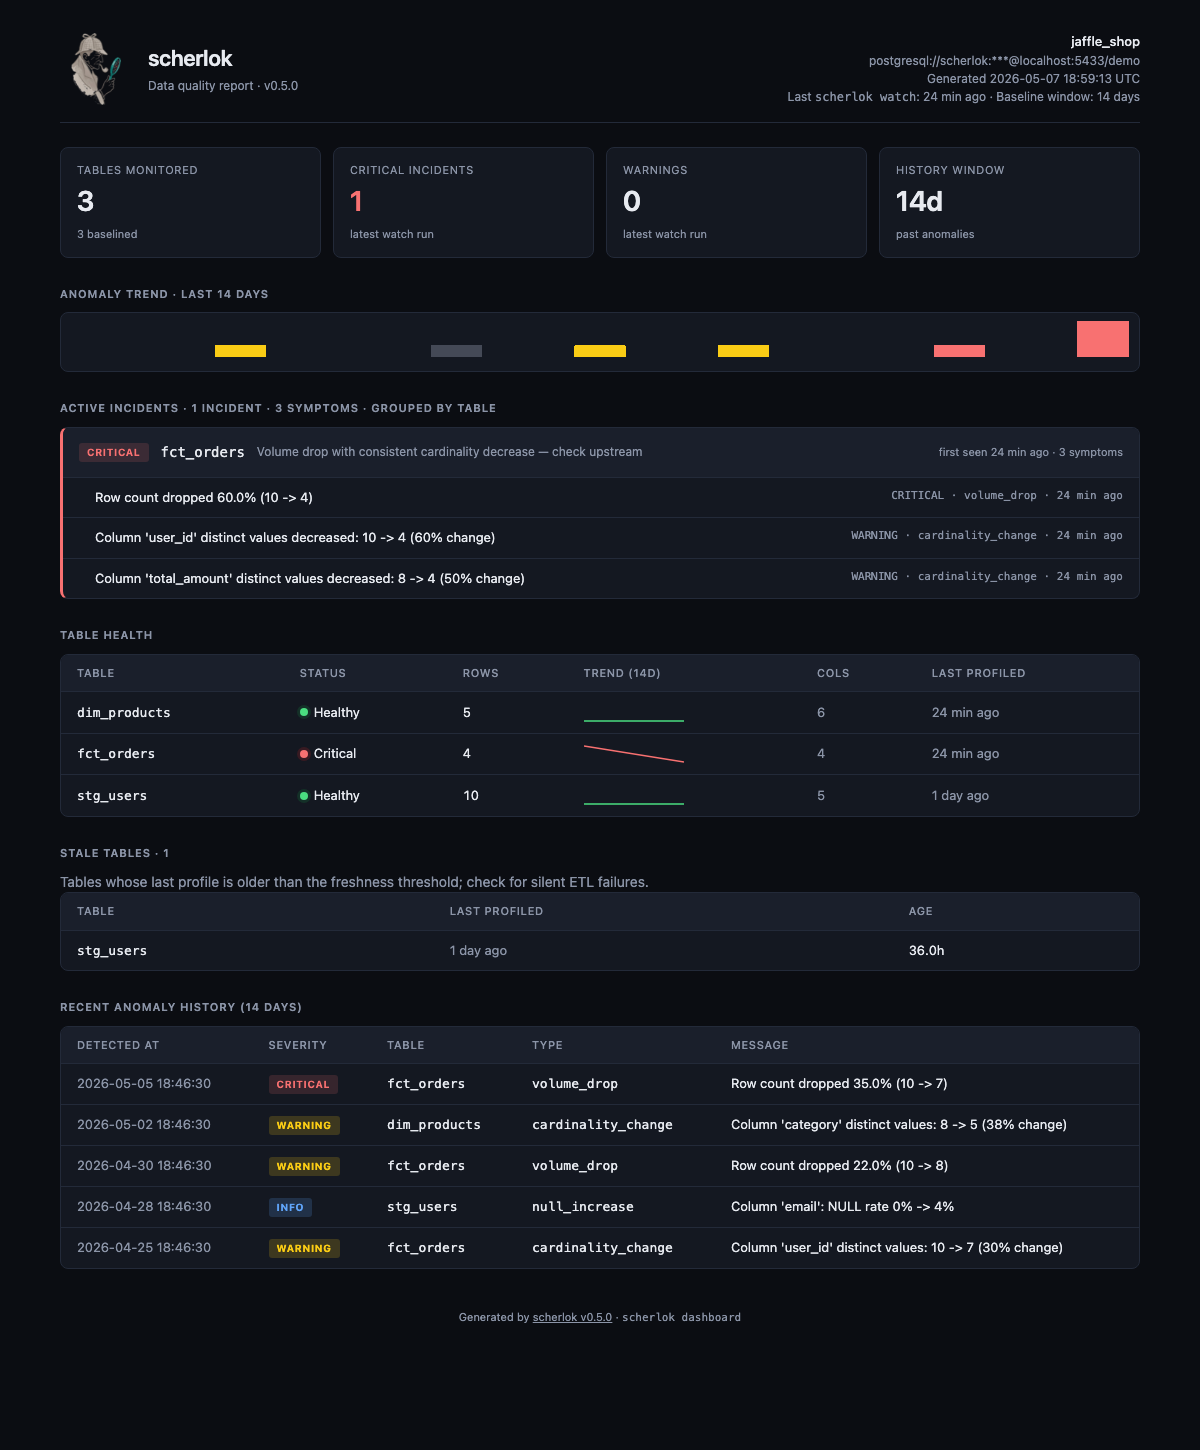
scherlok dashboard --out report.html
One self-contained HTML file (~28 KB): KPIs, per-table incidents grouped with first-seen timestamps, +/−/~ schema-drift diff, sparklines, and full anomaly history. Auto dark/light theme via prefers-color-scheme.
📖 Full docs: dashboard guide →
Use it from an AI agent (MCP)
Let Claude Code / Claude Desktop run data-quality checks directly.
Claude Desktop: download scherlok-<version>.mcpb from the latest release and open it. One click, one setting (your connection string, stored as a secret).
Any other client:
pip install scherlok # scherlok-mcp ships built-in since v0.7.0
{
  "mcpServers": {
    "scherlok": {
      "command": "scherlok-mcp",
      "env": { "SCHERLOK_CONNECTION": "postgresql://user:pass@host/db" }
    }
  }
}
The agent gets list_tables, investigate, watch, status, history, and check as tools. Credentials are resolved server-side (never passed by the model), every operation is read-only on the warehouse, and there's no arbitrary-SQL tool.
📖 Full docs: MCP server guide →
AI-explained alerts (--explain)
Your alert says what broke. --explain adds why — and what to check next.
pip install 'scherlok[explain]'
export ANTHROPIC_API_KEY=sk-ant-...

scherlok watch --webhook https://hooks.slack.com/... --explain
When anomalies fire, Scherlok makes one Claude call for the whole batch and injects a short root-cause hypothesis into the same Slack/Discord/Teams/email/JSON alert:
<div align="center"> <img src="examples/demo-explain.svg" alt="scherlok watch --explain: anomalies table followed by the AI hypothesis panel" width="760"> </div>Works on watch, ci, check, dbt, and dbt-run-and-watch. On dbt projects the hypothesis is lineage-aware: upstream parents from manifest.json go into the prompt, so cascading failures get traced to the source model instead of alerting on every downstream symptom.
- What it costs — one call per fired run (not per anomaly), Claude Haiku 4.5 by default: well under a cent per run (~$0.003). Override the model with
SCHERLOK_EXPLAIN_MODEL. Runs with zero anomalies make no API call. - What it sends — aggregates only: the anomaly type/severity/message strings already in your alert, dbt model names, detection timestamps. Never warehouse rows, cell values, or credentials — the test suite pins this as a contract.
- How to turn it off — it's opt-in; don't pass
--explain. If the API call fails (no key, timeout, rate limit), the original alert is delivered unchanged with a one-line note. Alerting never blocks on the LLM.
📖 Full docs: explainer guide →
Email alerts
export SCHERLOK_SMTP_HOST=smtp.gmail.com
export SCHERLOK_SMTP_USER=alerts@company.com
export SCHERLOK_SMTP_PASSWORD=app-specific-password

scherlok watch --email team@company.com --email cto@company.com
Connectors
# PostgreSQL
scherlok connect postgres://user:pass@host:5432/db

# BigQuery — see src/scherlok/connectors/bigquery.md for auth, billing, CI patterns
pip install scherlok[bigquery]
scherlok connect bigquery://project-id/dataset-name

# Snowflake
pip install scherlok[snowflake]
export SNOWFLAKE_USER=...
export SNOWFLAKE_PASSWORD=...
export SNOWFLAKE_WAREHOUSE=...
scherlok connect snowflake://account/database/schema

# MySQL
pip install scherlok[mysql]
scherlok connect mysql://user:pass@host:3306/dbname

# DuckDB
pip install scherlok[duckdb]
scherlok connect duckdb:///path/to/file.db
| Database | Status |
|---|---|
| PostgreSQL | Available |
| BigQuery | Available |
| Snowflake | Available |
| MySQL | Available |
| DuckDB | Available |
Remote Storage
Share profiles across CI runs and team members:
# AWS S3
scherlok config --store s3://my-bucket/scherlok/profiles.db

# Google Cloud Storage
scherlok config --store gs://my-bucket/scherlok/profiles.db

# Azure Blob Storage
scherlok config --store az://my-container/scherlok/profiles.db
How it compares
| Scherlok | Elementary | Soda | Great Expectations | Monte Carlo | |
|---|---|---|---|---|---|
| Open-source core | MIT | Apache-2.0 dbt package + CLI | Apache-2.0 Soda Core | Apache-2.0 GX Core | No (SaaS) |
| Config before detection starts | None | YAML per anomaly test | SodaCL YAML checks | Expectations you declare | Monitors configured in the product |
| Learns baselines in the free tier | Yes, automatically | Yes, with per-test config | No (needs Soda Library + Cloud) | No (validates declared expectations) | n/a |
| Works without dbt | Yes | No | Yes | Yes | Yes |
| Self-hosted | Yes | OSS yes; Cloud is managed | Core yes; Cloud is managed | Core yes; Cloud is managed | No |
| Pricing | Free | OSS free; Cloud by seats and environments | Core free; Cloud has a free plan | Core free; Cloud has a free Developer option | Quote-based |
Every claim links to the other tool's own documentation in the full comparison.
CLI Reference
scherlok connect <url>          Connect to a database
scherlok investigate            Profile all tables (learn patterns)
scherlok watch [-w <url>] [-e <email>]  Detect anomalies and alert
scherlok ci <url> [opts]        All-in-one CI/CD command (connect + watch + exit code)
scherlok dbt [--project-dir .] [--output json]  Profile dbt models from manifest
scherlok dbt-run-and-watch [--build] [--output json]  Run dbt + profile in one step
scherlok status [--output json] Quick health dashboard
scherlok history [--days N] [--output json]  Timeline of past anomalies
scherlok report                 Detailed profile summary
scherlok dashboard [--out .html] Generate self-contained HTML report
scherlok config --store <url>   Set remote storage
scherlok demo [--keep] [--output json]  Self-contained demo on a sample DuckDB (no database needed)
scherlok version                Show version
Install
pip install scherlok

# With BigQuery support
pip install scherlok[bigquery]
Requires Python 3.10+.
Run via Docker
A pre-built image with every warehouse extra (dbt, bigquery, snowflake) is published to GitHub Container Registry on every release tag:
docker run --rm ghcr.io/rbmuller/scherlok:latest version
Mount your project directory and inject connection details the same way your CI does it; the entrypoint is the scherlok CLI:
docker run --rm \
  -v "$PWD:/work" -w /work \
  -e SCHERLOK_CONNECTION=postgres://... \
  ghcr.io/rbmuller/scherlok:latest watch
The image is built from python:3.12-slim and runs unprivileged (USER scherlok).
Contributing
Contributions welcome! See CONTRIBUTING.md.
We're especially looking for:
- New database connectors (e.g. Databricks — see #37)
- Anomaly detection improvements
- Documentation and examples
Star History
<a href="https://star-history.com/#rbmuller/scherlok&Date"><img src="https://api.star-history.com/svg?repos=rbmuller/scherlok&type=Date" alt="Star History Chart" width="600"></a>
License
MIT — Developed by Robson Bayer Müller
Related MCP servers


Offline MCP server for planning structured project specs — validate, render, and checklist tools.

LicenseGuard
Check if a dependency's license obligates you, based on how you ship. npm, PyPI, Go.

MCP tools for AI agents: fetch any URL as clean text, live crypto prices, review & bid drafting.
View repository →Cut LLM token costs: count tokens, estimate cost, slim prompts, and pick the cheapest capable model.
View repository →AI brand/token visibility, prediction-market odds & cheap x402 data feeds for AI agents.
View repository →