io.github.vmoranv/jshookmcp MCP Server
io.github.vmoranv/jshookmcp
600+ tools for JavaScript analysis, security auditing, browser automation, and reverse engineering in a single MCP server.
What is the io.github.vmoranv/jshookmcp MCP server?
The jshook MCP server is a comprehensive JavaScript analysis and security research platform that exposes 600+ tools across 34 domains for AI agents. It enables browser automation, CDP debugging, network interception, JS hooks, LLM-powered code analysis, WASM reverse engineering, and process forensics—all accessible through a unified MCP interface.
jshook provides a complete toolkit for JavaScript security research, malware analysis, and browser automation. It combines AI-driven deobfuscation, full-stack browser control (Chromium/Camoufox), network interception, WASM disassembly, memory forensics, and dynamic code transformation. Use it to audit JavaScript security, reverse-engineer obfuscated code, automate browser tasks with anti-detection, intercept and analyze network traffic, or perform runtime instrumentation and forensics.
How to install io.github.vmoranv/jshookmcp
Copy-paste configuration for popular MCP clients.
Tools & capabilities
Tools this server exposes to the agent.
search_tools— Hybrid BM25 + vector search meta-tool for discovering and ranking available toolsdescribe_tool— Schema-first meta-tool to inspect tool signatures and parameterscall_tool— Validated tool invocation with parameter error reductioncoverage_report— Visibility into tool coverage and activation statusbrowser automation tools— Full-stack Chromium/Camoufox control with CDP, anti-detection, and CAPTCHA handlingnetwork interception tools— HTTP/2 frame building, MiTM capture, GraphQL analysis, Burp Suite bridgeWASM tools— WASM disassembly, binary analysis, and reverse engineeringAST transform tools— Dynamic code transformation and analysismemory & process forensics tools— Native FFI scanning, hardware breakpoints, PE introspectionsource-map reconstruction tools— Source map analysis and reconstructionV8 inspector tools— V8 runtime inspection and debuggingprotocol analysis tools— Protocol-level inspection and manipulationproxy tools— Local HTTPS interception with auto-generated CAinstrumentation tools— Runtime instrumentation and hooksworkflow tools— Composite workflow execution and coordination
Use cases
- Audit JavaScript security vulnerabilities and detect obfuscation/crypto patterns using LLM-powered analysis
- Automate browser tasks with anti-detection, CAPTCHA solving, and session management across Chromium and Camoufox
- Intercept and analyze network traffic (HTTP/2, GraphQL) for security testing and protocol reverse engineering
- Reverse-engineer WASM binaries, obfuscated JavaScript, and native code using disassembly and binary analysis tools
- Perform runtime memory forensics, process instrumentation, and dynamic code transformation for malware analysis
io.github.vmoranv/jshookmcp MCP server FAQ
jshook is an MCP server providing 600+ tools across 34 domains for JavaScript analysis, security auditing, browser automation, network interception, WASM reverse engineering, and process forensics. It integrates LLM-powered deobfuscation, full-stack browser control, and runtime instrumentation in a single unified interface.
Yes, jshook is open-source under the AGPLv3 license. It is free to use and modify.
Add the following to your `claude_desktop_config.json` (or equivalent MCP config): {"jshook": {"command": "npx", "args": ["-y", "@jshookmcp/jshook@latest"], "env": {"MCP_TOOL_PROFILE": "search", "npm_config_omit": "optional"}}}. On Windows, use the absolute path to `npx.cmd` if needed.
Node.js 22.12+ and pnpm 10.x are required. The lightweight `search` profile skips optional ONNX, Z3, Binaryen, Camoufox, and Playwright packages; remove `npm_config_omit` to enable full-profile runtimes.
By default, jshook runs as a local stdio process with no authentication. If you run the shared HTTP daemon and expose it beyond localhost, set `MCP_AUTH_TOKEN` before exposing the endpoint.
Yes. Run `pnpm daemon` to start a shared HTTP daemon on `http://127.0.0.1:3000/mcp`. Each MCP client gets its own session while sharing the embedding model, browser runtime, and caches. Point your MCP clients to the HTTP endpoint instead of stdio.
README (reference)
Source of truth, from the repository.
@jshookmcp/jshook





English | 中文
An MCP server that gives AI agents 600+ tools across 34 domains for JavaScript analysis and security research — browser automation, CDP debugging, network interception, JS hooks, LLM-powered code analysis, process/memory forensics, WASM reverse engineering, source-map reconstruction, AST transforms, and composite workflows in a single server.
Quick Links
🚀 Quick Start
No global install needed — add to your MCP client config and you're ready:
Claude Desktop / Cursor (claude_desktop_config.json):
{
  "mcpServers": {
    "jshook": {
      "command": "npx",
      "args": ["-y", "@jshookmcp/jshook@latest"],
      "env": {
        "MCP_TOOL_PROFILE": "search",
        "npm_config_omit": "optional"
      }
    }
  }
}
(Windows: use npx.cmd absolute path if npx is not found)
This lightweight configuration skips optional ONNX, Z3, Binaryen, Camoufox, and Playwright
packages. Remove npm_config_omit when those full-profile runtimes are required.
Share one daemon across multiple agents
The default stdio configuration starts one full jshook process per MCP host. To share the embedding model, browser runtime, and caches, start one local Streamable HTTP daemon:
pnpm build
pnpm daemon
Vector search defaults to off for per-client stdio processes and on (lazy-loaded) for the shared
HTTP daemon. Set SEARCH_VECTOR_ENABLED=false when lexical search is sufficient.
Then point every MCP client at http://127.0.0.1:3000/mcp using its HTTP/URL server
configuration. Each client receives its own MCP session and response route while heavyweight
runtime resources remain in one process. Keep the default loopback bind; set MCP_AUTH_TOKEN
before exposing the endpoint beyond localhost.
🌟 Highlights
- 🤖 AI-Driven Analysis — LLM-powered deobfuscation, crypto detection, AST comprehension
- ⚡ Search-First Context Efficiency —
searchprofile ≈ 3K tokens vsfull≈ 40K+ tokens - 🎯 Progressive Tiers —
search→workflow→full, activate on demand - 🌐 Full-Stack Browser Automation — Chromium/Camoufox + CDP + anti-detection + CAPTCHA handling
- 🔁 Runtime Recovery and Session Isolation — HTTP sessions restore activated domains, browser attach state, coverage state, and isolate browser-side session state per client
- 🧭 Schema-First Meta Tools —
describe_tool, validatedcall_tool, andcoverage_reportreduce parameter errors and make tool coverage visible - 📡 Network Interception — HTTP/2 frame building, MiTM capture, GraphQL, Burp Suite bridge
- 🛠️ Reverse Engineering Toolchain — WASM disassembly, binary analysis, Frida, Ghidra/IDA bridges
- 🧰 Process & Memory Forensics — Native FFI scanning, hardware breakpoints, PE introspection
- 🧩 Dynamic Extensibility — Hot-reload plugins, declarative workflows, auto-discovered domains
Recent Runtime Notes
- HTTP transport now multiplexes independent MCP sessions and restores runtime state after reconnects.
proxy_startauto-generates a local HTTPS interception CA when needed.- Browser CAPTCHA solving is now explicit-input driven: pass
taskKind,siteKey,imageBase64,callbackName, andresponseSelectoras needed. Built-in widget/page signature probing is intentionally not used.
Architecture
- Runtime Registry — Domains auto-discovered via
manifest.ts; add a domain by creating one file - Lazy Initialization — Handlers instantiated on first call, not at startup
- BM25 + Vector Search —
search_toolsmeta-tool with hybrid ranking and adaptive weights - MCP ToolAnnotations — Every tool carries
readOnlyHint/destructiveHint/idempotentHint/openWorldHint
Registry Snapshot
The built-in surface below is generated from the runtime registry and checked in CI.
<!-- metadata-sync:start -->- Package version:
0.3.5 - Built-in Tools:
668 - Domains:
adb-bridge,binary-instrument,boringssl-inspector,browser,canvas,coordination,core,cross-domain,dart-inspector,debugger,encoding,exploit-dev,extension-registry,graphql,instrumentation,maintenance,memory,mojo-ipc,native-bridge,native-emulator,network,platform,process,protocol-analysis,proxy,sourcemap,streaming,syscall-hook,trace,transform,v8-inspector,wasm,webgpu,workflow - Note: this snapshot is generated from the runtime registry; do not edit the counts by hand.
Project Stats
<div align="center"> <a href="https://www.star-history.com/?repos=vmoranv%2Fjshookmcp&type=date&legend=top-left"> <picture> <source media="(prefers-color-scheme: dark)" srcset="https://api.star-history.com/image?repos=vmoranv/jshookmcp&type=date&legend=top-left" /> <source media="(prefers-color-scheme: light)" srcset="https://api.star-history.com/image?repos=vmoranv/jshookmcp&type=date&legend=top-left" /> <img alt="Star History Chart" src="https://api.star-history.com/image?repos=vmoranv/jshookmcp&type=date&legend=top-left" /> </picture> </a>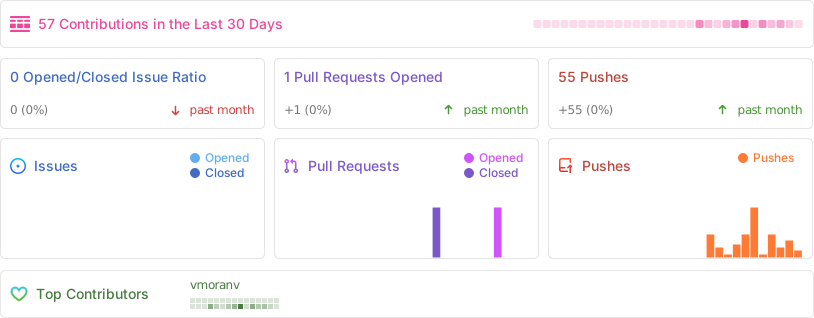
Related MCP servers

VMware AIops
AI-powered VMware vCenter/ESXi VM lifecycle, deployment, and cluster management with 60 MCP tools.
VMware Aria Operations
VMware Aria Operations: metrics, alerts, capacity, anomaly detection — 44 MCP tools.
VMware AVI
VMware AVI (NSX ALB) load balancer plus AKO Kubernetes ops — 28 MCP tools.
VMware Debug
VMware incident timeline, root-cause routing, local case ledger; no vSphere access. 14 MCP tools.
VMware Harden
VMware compliance scanning (CIS, vSphere SCG, GB/T 22239, PCI-DSS) with drift detection.
VMware Log Insight
Read-only VMware Aria Operations for Logs (Log Insight): search + aggregation. 7 MCP tools.